
Laboratory 9
Case Study
Case
Bebang is back to consult you about her business. Furthering her data analytics initiative she asks you for help to compute some relevant data. Now she is asking you to compute and visualize her sales and costs for the past year. She has given you the datasets attached to her request.
Problem
Bebang asked for help in knowing the monthly revenues, costs, and profits from the sale data last year provided. A CSV with prices per donut flavor and their costs was also provided by Bebang to also know the sales of each flavor for a whole year. Moreover, the deliverables of the activity are to provide a code for computing the values needed such as the monthly cost, monthly revenues, and monthly profit. Upon getting the values needed, getting the top 3 best and worst flavors can be done by sorting the data gathered. Lastly, a graph can also be provided to better visualize and analyze the data gathered to come up with an idea to improve the things that might help the business to grow more.
Data on hand
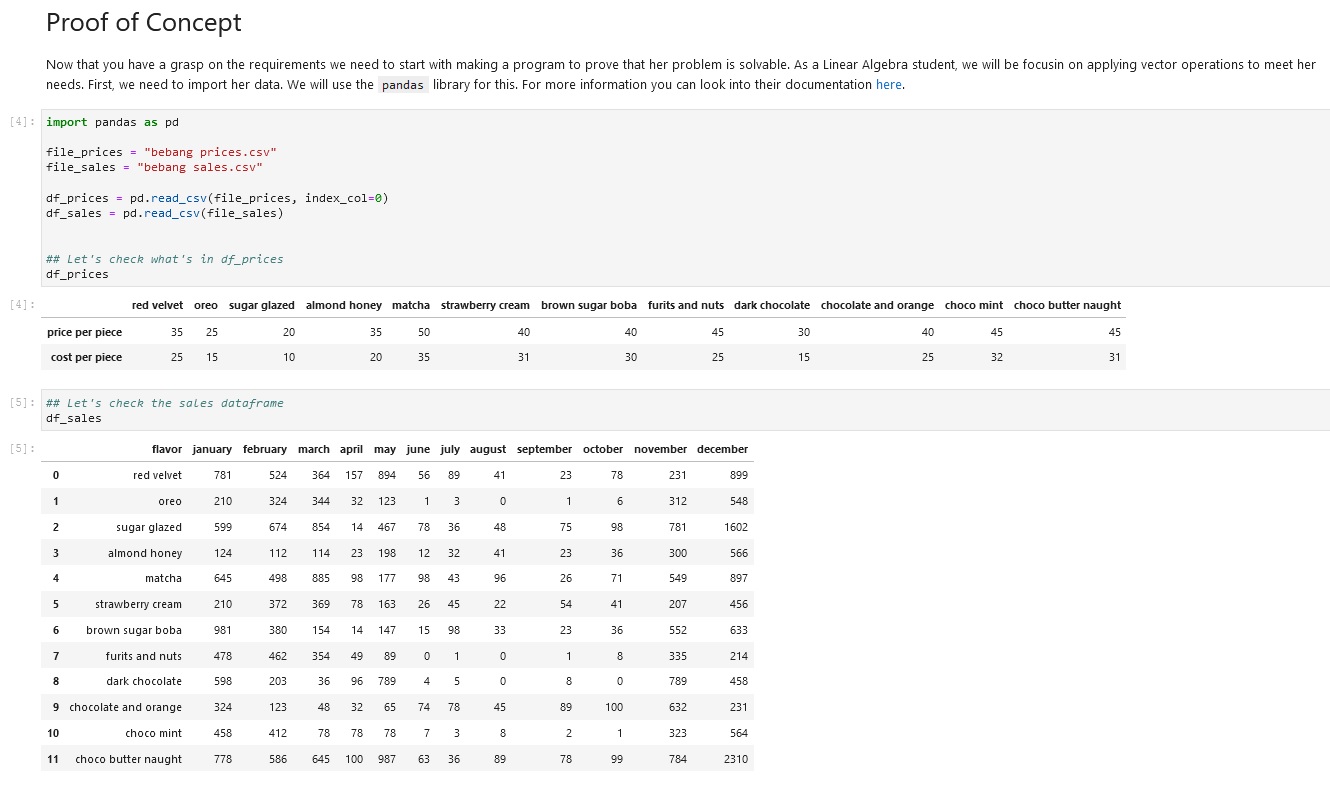
The Figure above shows the data given by Bebang to be analyzed to solve the case
Part 1
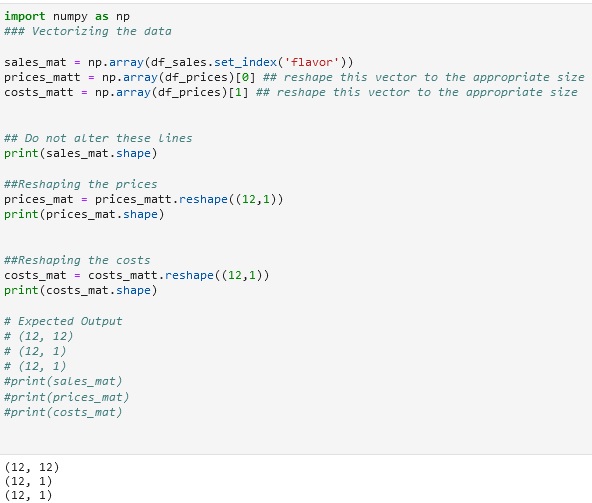
The code snippet above shows how to vectorize data and reshape a matrix to make the computation possible between the values.
Part 2
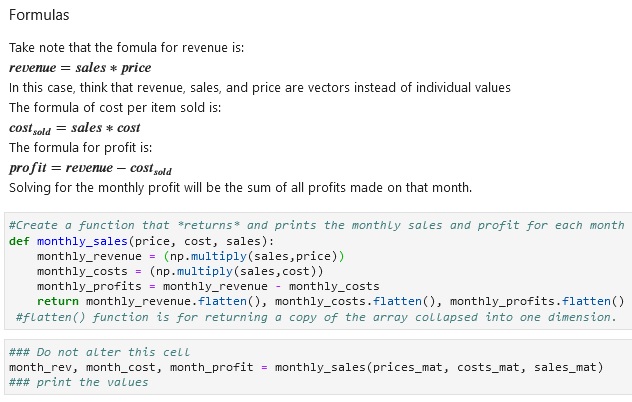
The Figure above shows the formulas needed to compute for values requested by Bebang and the function created to print the monthly sales and profit for each month.
Monthly revenues
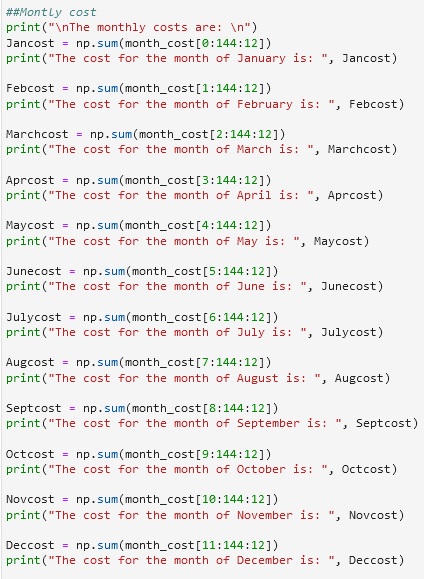
Monthly cost
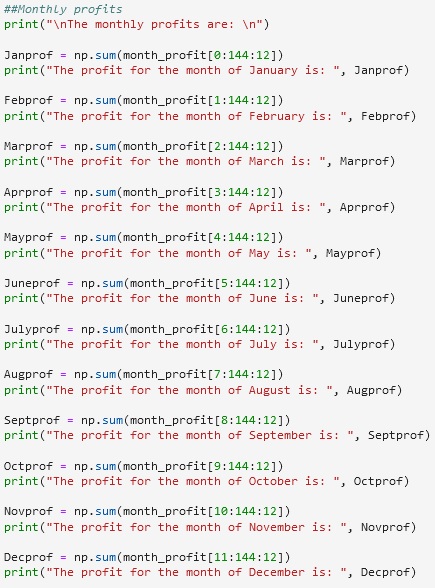
Monthly Profits
Output
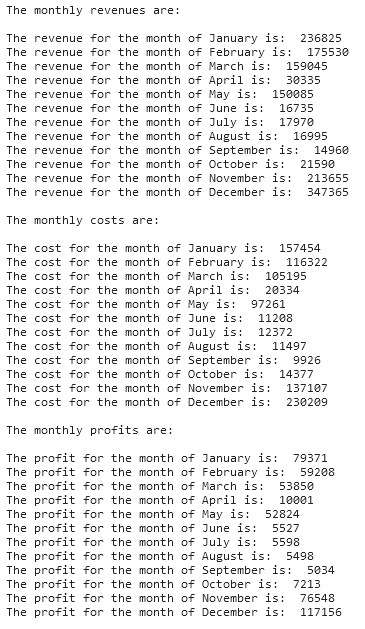
The Figure above shows the monthly revenues, monthly cost, and monthly profits of Bebang based on the data he/she provides
Part 3
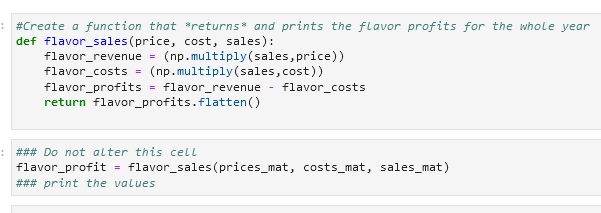
The code snippet above shows the function created for the computation of profits of the flavors for the whole year.
Part 4
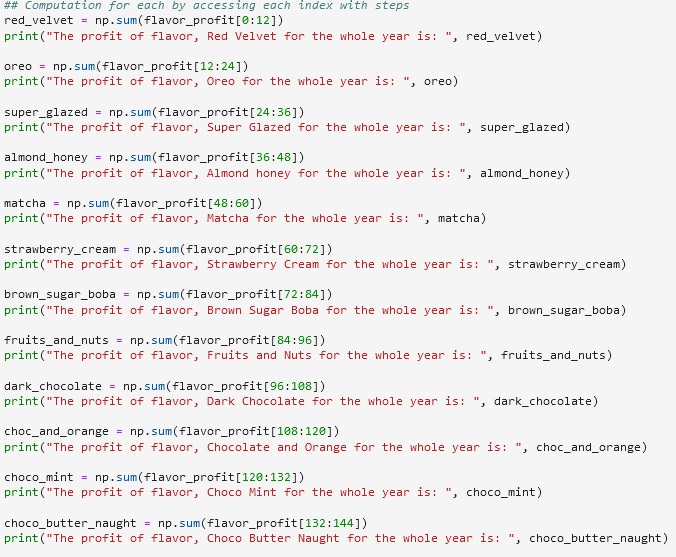
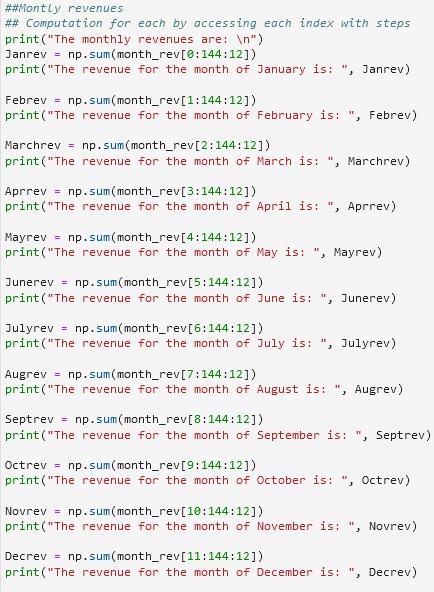
The code snippet above shows the code executed to print the values of profits for each month
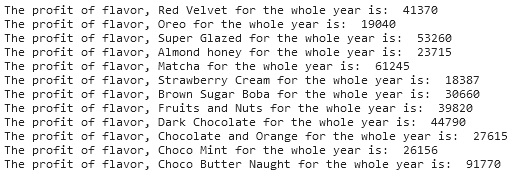
Flavor Profits
Part 4
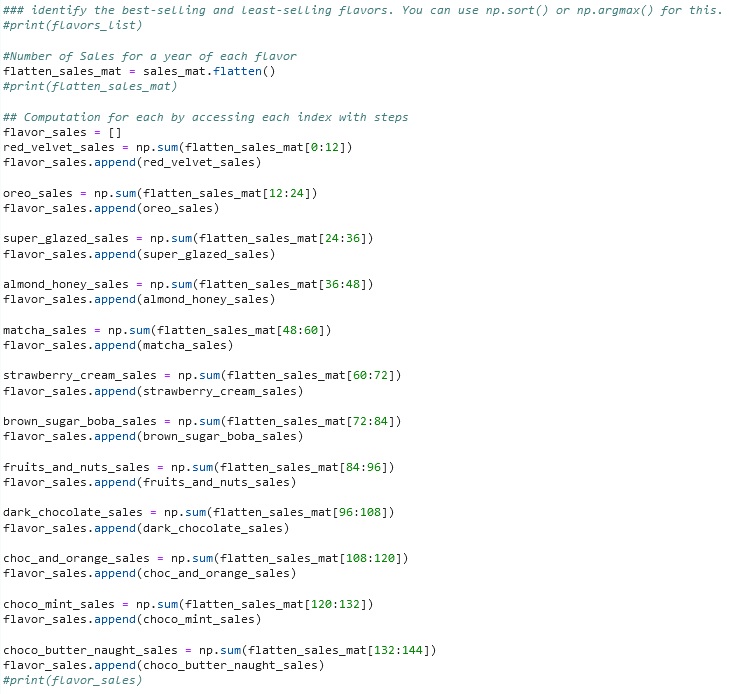
The Figure above shows the block of code created for accessing the sales values of each flavor and appending it to a list to sort it out.
Part 5
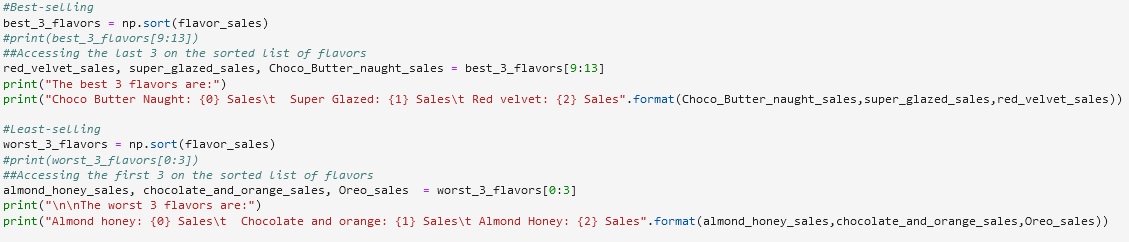
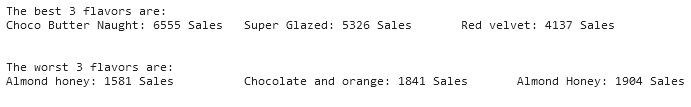
The code snippet above shows the code for identifying the best and worst flavors for a year.
The best and worst flavors
Business recommendation
After getting all the data needed, it can be observed every part of the data such as what month has the highest profit or what flavor is the most popular for the customers. It can also be observed what month specifically one flavor excels in sales. From knowing that, the stock of the ingredients for that specific flavor can be minimized to lessen the cost needed for a month. The sales for November to January are great however, it is noticeable that from June to October the sales are struggling. If from the previous years the results from the said months are also not good, the only way is to minimize the cost for those months as much as possible to save money and go all out from November of that year up until the first quarter of the next year.