
Laboratory 5
Multi-dimensional Vectors
This laboratory activity aims to implement the principles and techniques of representing multi-dimensional vectors or linear combinations in a 3-dimensional plane.
The practices of the activity include creating a system of a linear equation and representing it on a 3-dimensional plane. This teaches and implies the techniques for representing vectors using a different method of plotting in a 2D or 3D plane. The deliverables of the activity are to provide a system of a linear equation and scalar values for plotting on 2D and 3D planes. Moreover, it was achieved by creating an array of vectors and creating random values for scalars by using np.range() function that “return evenly spaced values within a given interval” [1]. The mathplotlib.pyplot.gca() function was used to get the current axes and project them in 3D [2]. For the creation of a figure object, the plt.figure() function was used [3] while plt.plot() was used to plot the vectors [4] and the plt.show() was used to show the plotted vectors on the plane [5].
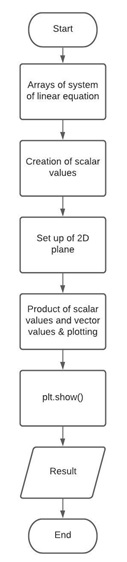
Activity 1 Flowchart
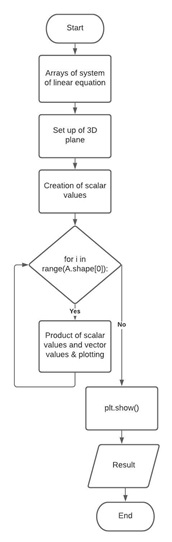
Activity 2 Flowchart
The results from the two tasks given to be familiar in representing multi-dimensional vectors and plotting system of linear equation in 2D and 3D-dimensional planes are presented in this section.
Activity 1
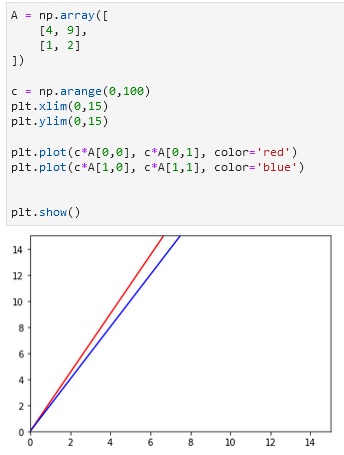
Figure above shows the block of code created and its vector visualization output plotted in a 2D plane. The result represents the continuous line of the system of linear equations in the 2D plane. Each vector value were multiplied to the scalar values resulting in its scaled version or the continuous line shown in Figure 3.
Activity 2
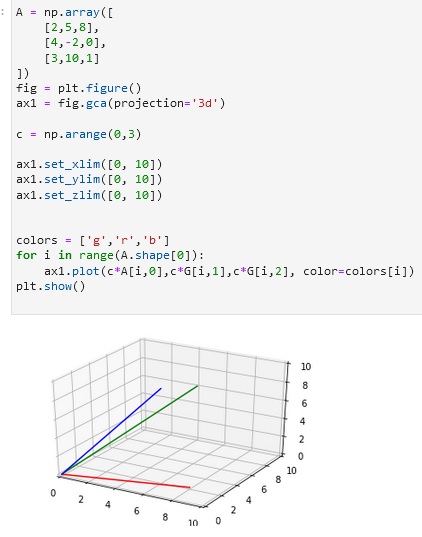
Figure above shows the block of code created to plot the 3-dimensional vector on a 3D plane. Two objects were created which is the figure and the axis using the plt.figure() and the plt.gca() function. The projection of this was specified in 3D and the limit for x, y, and z was set afterward. Lastly, a loop statement was used in plotting the values. For the number of rows, it’s going to plot with its corresponding column values which are also scaled.
Note:
According to [6], every data set has a general structure and is always characterized by the group of variables or the dimensions. It was stated in [6] that the variable in one-dimensional is usually time, while in two-dimensional, it can be data usually found in statistics like the number of financial transactions in a specific period and for the three-dimensional, it’s just an extension of 2D therefore, an additional dimension can be added like for example in the financial transactions in a specific period, another dimension can be added like the customer type in observing the data. Data can have more than three-dimension according to [7], for this particular example, it shows a relational database about the sales volumes for a printing company.
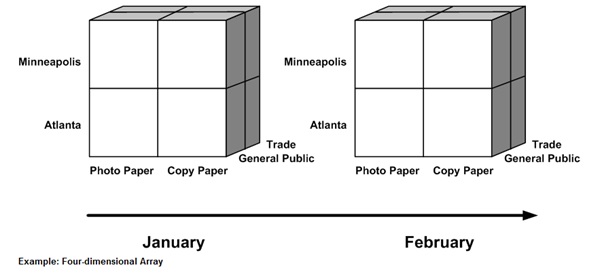
Figure above shows the example of data with four-dimensional from [7], the following dimensions are store, item, customer type, and time.
So what’s this all about?
This laboratory implements the principles and techniques of representing multi-dimensional vectors. Through discussion and activities, you have familiarized myself with plotting a 3-dimensional vector and a system of linear equations in 2D and a 3D plane.
Real-world application
The concepts of visualizing and representing vectors in n-dimensions for business applications can be applied in compiling records to be observed for a certain period like for example, the number of items sold in a store during week 1 and from what type of transaction was done [7].
References
[1]”numpy.arange — NumPy v1.19 Manual”, Numpy.org, 2020. [Online]. Available: https://numpy.org/doc/stable/reference/generated/numpy.arange.html. [Accessed: 01- Nov- 2020].
[2]”matplotlib.pyplot.gca — Matplotlib 3.3.2 documentation”, Matplotlib.org, 2020. [Online]. Available: https://matplotlib.org/3.3.2/api/_as_gen/matplotlib.pyplot.gca.html. [Accessed: 01- Nov- 2020].
[3]”matplotlib.pyplot.figure — Matplotlib 3.3.2 documentation”, Matplotlib.org, 2020. [Online]. Available: https://matplotlib.org/3.3.2/api/_as_gen/matplotlib.pyplot.figure.html. [Accessed: 01- Nov- 2020].
[4]”matplotlib.pyplot.plot — Matplotlib 3.3.2 documentation”, Matplotlib.org, 2020. [Online]. Available: https://matplotlib.org/3.3.2/api/_as_gen/matplotlib.pyplot.plot.html. [Accessed: 02- Nov- 2020].
[5]”matplotlib.pyplot.show — Matplotlib 3.3.2 documentation”, Matplotlib.org, 2020. [Online]. Available: https://matplotlib.org/3.3.2/api/_as_gen/matplotlib.pyplot.show.html. [Accessed: 02- Nov- 2020].
[6]Citeseerx.ist.psu.edu, 2020. [Online]. Available: https://citeseerx.ist.psu.edu/viewdoc/download?doi=10.1.1.83.3421&rep=rep1&type=pdf. [Accessed: 02- Nov- 2020].
[7]”Multidimensional Databases”, Docs.oracle.com, 2020. [Online]. Available: https://docs.oracle.com/cd/E12478_01/rpas/pdf/150/html/classic_client_user_guide/basic_rpas_concepts/multidimensional_databases.htm. [Accessed: 02- Nov- 2020].